Posts mit dem Label Reality werden angezeigt. Alle Posts anzeigen

Dienstag, 14. Oktober 2014

Chinesische Goldnachfrage: Goldbörse in Shanghai übertrumpft Handelsplatz in Hongkong um Längen

Aktueller Bericht von Mineweb:

Making sense of Chinese gold demand

How much has Chinese gold demand fallen this year – 50% or perhaps only 10%? We unravel the conflicting data, which will ultimately be key to where the gold price is headed.
Author: Lawrence Williams
Posted: Monday , 13 Oct 2014 

LONDON (MINEWEB) - 
There is no doubt at all that Chinese demand for physical gold is having, and will continue to have, a huge impact on global gold flows and on the supply/demand balance, but making sense of the various figures quoted by the media is difficult and often counter-intuitive. 
For the serious follower of gold, perhaps there are two statistical analysts whose handles on Chinese data should be an absolute must to follow as they look far deeper into the statistics that are available to view – the Hong Kong net gold import figures into mainland China and the withdrawals from the Shanghai Gold Exchange (SGE) – the true indicator of Chinese physical gold demand. SGE figures are published weekly in Chinese so tend to be ignored by most of the global media while Hong Kong gold import/export figures are released monthly (in English) and are seized upon, misleadingly of late, by the press as a proxy for what is actually going on in terms of total Chinese gold demand.
Two of the best statistical analysts for understanding what is really going on in Chinese gold demand are Netherlands-based Koos Jansen, who has his own website ingoldwetrust.ch, but nowadays writes mostly for Singapore gold dealer bullionstar.com, and Australia’s chart king, Nick Laird, who again publishes his data on his own site sharelynx.com, and many significant gold-related ones on goldbroker.com. Do take a look at these sites for an understanding of what is actually happening now in terms of Chinese gold demand, as ever since the second quarter of the current year Hong Kong import/export statistics have become further removed from being a true indicator of Chinese demand and imports. This is because the Middle Kingdom has hugely eased the path for gold to be imported into China through other ports of entry which are now handling the major part of the country’s gold coming in from abroad.
This becomes hugely apparent if one views Nick Laird’s latest chart showing Hong Kong net gold exports to China, SGE withdrawals and the ratio between the two. As can be seen from the chart (shown below) from the period between mid 2011 up to April of the current year there was a strong correlation between the two main sets of statistics, but for the past four months the two sets of figures have drifted hugely apart as the new gold import routes have opened up. As the chart showing the correlation between the two shows, Hong Kong net gold export figures into the Chinese mainland are currently running at only around 15% of SGE withdrawals and falling – yet still some of the mainstream media has taken these falling Hong Kong figures as a direct indicator (and a very misleading one at that) of an enormous drop in Chinese gold demand.
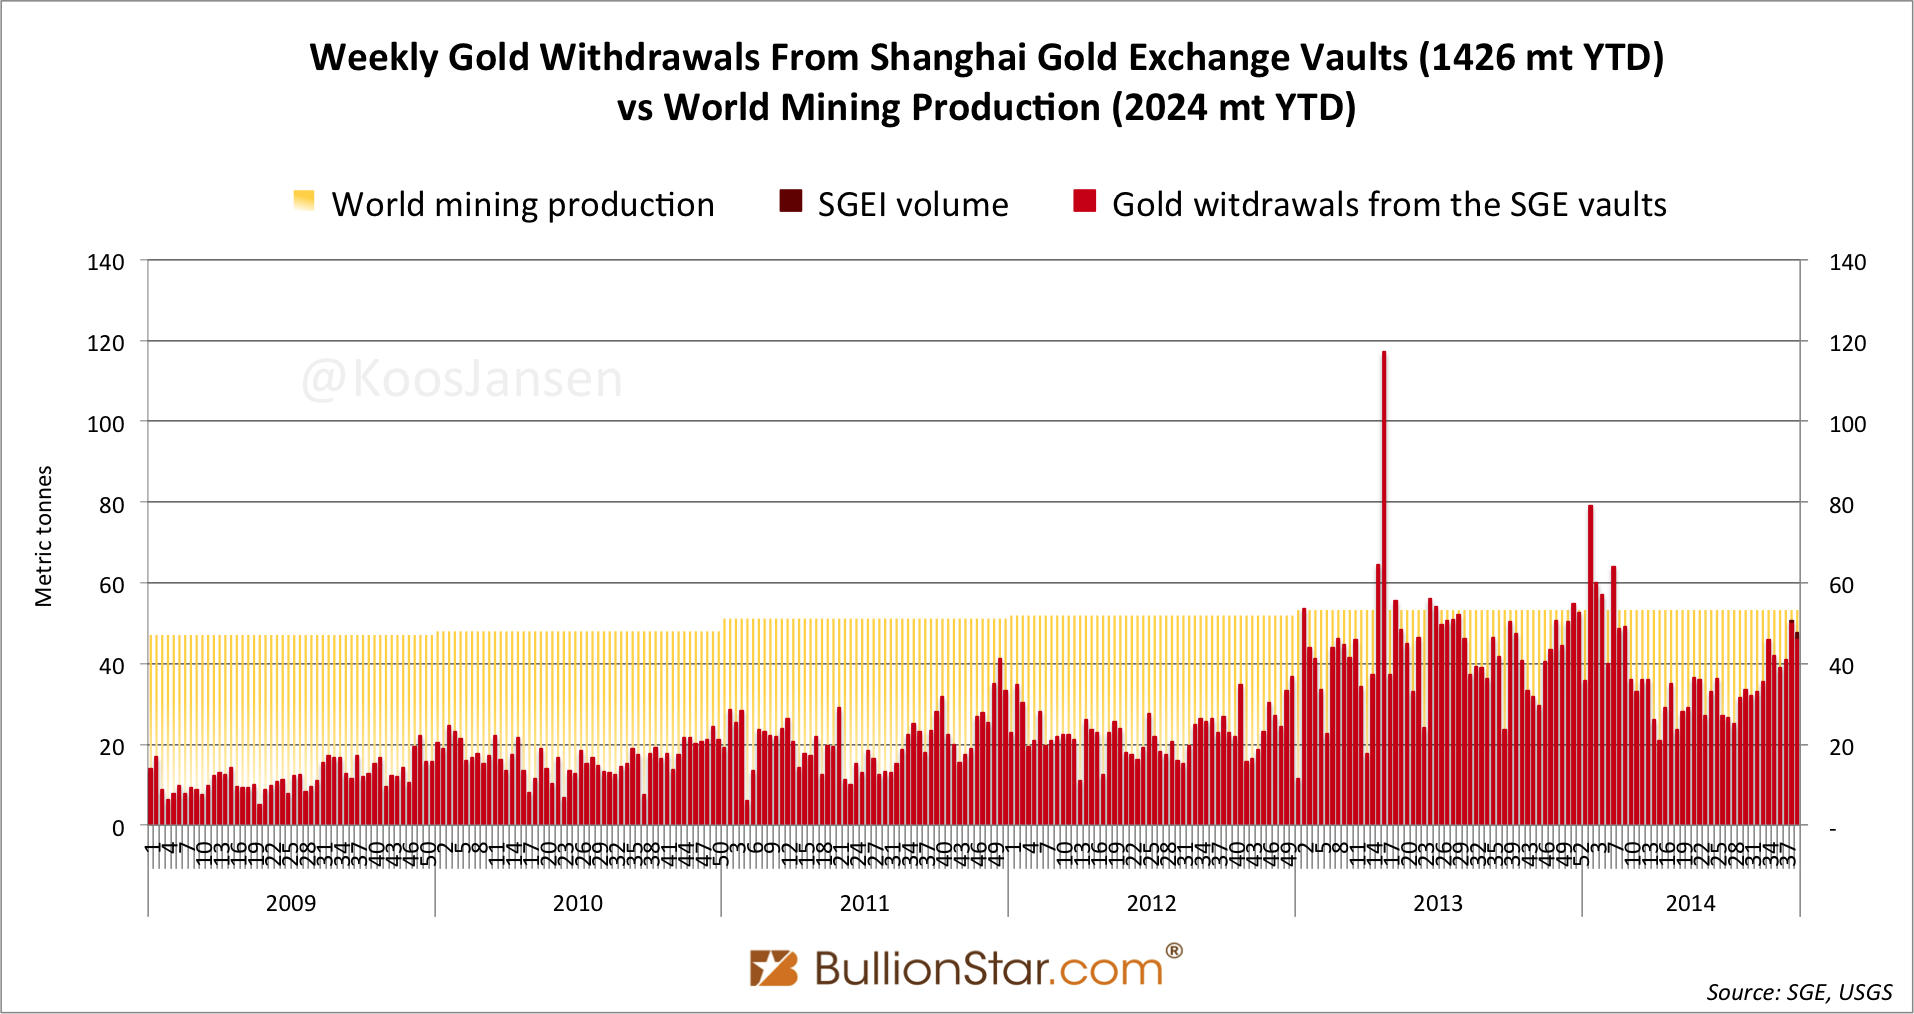
If one looks at SGE withdrawals on a month by month basis, it is also true that these do show a mid-year decline in Chinese demand – but not by nearly as much as a reliance on the Hong Kong figures would suggest – with a climb back to around 2013 demand levels in August, and from data picked up by Koos Jansen (and no doubt by Nick Laird too) this demand has been accelerating. For example the latest available weekly withdrawal figure from the SGE was a very large 44 tonnes, following on from an even larger 50 tonnes the previous week. These figures were immediately ahead of China’s Golden Week holiday so will probably have been distorted higher but taken with the prior weekly figures the indication is that total Chinese SGE withdrawals during September will have been around 190 tonnes plus. This, of course, equates to an annual rate of over 2 200 tonnes. This annual level will not be achieved in 2014 due to the weaker mid-year demand, but is an indicator that full year Chinese demand remains at a very high level indeed and the gloomy mainstream media talk of a 40%-50% downturn this year should be taken as absolute rubbish. At current demand levels – and the final quarter of the year tends to be strong in China – we are looking at perhaps as little as a 10%-15% decline from the huge 2013 record.
Chart published courtesy of www.goldbroker.com .  All rights reserved.  Direct link to original chart
But how much should be read into these figures in terms of likely gold prices ahead? In 2013, for example, the gold price fell back sharply despite the huge demand from the East and Middle East. This was primarily because of the very large outflows from the gold ETFs which primarily took place in the main gold price-setting markets of the West. This year Eastern demand may have fallen back a little, but has picked up strongly in the past few weeks, and although we have seen some gold liquidations out of the major ETFs in the West this has been nowhere near on the scale we saw a year ago – indeed in some months the ETFs have actually seen small inflows.
With the latest Reuters reports of rising gold purchasing in China and India again – the two biggest global markets for gold - and increasing gold premiums in both countries over and above the London price - we could well be poised for a significant turning point in the gold price based on fundamentals at least. By all accounts gold mine production is peaking while demand still continues to rise and gold supply, which is calculated by precious metals analysts Metals Focus as having been in deficit last year, could be heading that way again this year too.   
There is considerable geopolitical turmoil in the world which has to boost safe haven demand, at least in some areas and it is becoming increasingly apparent that the global economy is not recovering as fast as many had hoped. The US Fed is getting nervous about the idea of allowing interest rates to rise, while the Eurozone is looking at more Quantitative Easing. 
All these factors might be seen as positive for gold, and all things being equal would probably lead to a sharp rise in the gold price in the months ahead. But then all things are not equal.  The western commodity markets are hugely distorted by the big money playing the futures market with amounts of paper gold enormously in excess of physical gold availability perhaps by as much as a factor of 100 or more. Should market participants start demanding settlement in physical gold there would be a massive increase in gold price and undoubtedly some of the big short position holders would be bankrupted. But, unfortunately for the pro-gold sector, this seems very unlikely to happen.
However there has also been a move in the East to set up new international commodity exchanges which will deal only in physical metal – notably in Shanghai with the international arm of the Shanghai Gold Exchange (SGEI) located in the Shanghai Free Trade Zone, and in Singapore with the Singapore Precious Metals Exchange (SGPMX). There are also reports that CME Group will launch a physically deliverable contract in Hong Kong later this year and in the Middle East, Dubai is said to be preparing to launch a physical contract too. The effect of these new trading options will be limited initially, but as they gain traction and physical gold continues to move from West to East, which shows no signs of coming to an end, then there could be some dramatic gold price moves ahead in the medium to long term.

Quote:

Offizielle Bestätigung vom SGE-Chef: Chinesische Goldnachfrage lag 2013 bei 2.000 physischen Tonnen

Samstag, 11. Oktober 2014

Offizielle Bestätigung vom SGE-Chef: Chinesische Goldnachfrage lag 2013 bei 2.000 physischen Tonnen

Hierzu ein aktuelles Statement von Peter Boehringer, Gründer der PBVV Vermögensberatung in München und Vorstand der Deutschen Edelmetall-Gesellschaft e.V.:

"Unten zK: der unabhängige Goldanalyst Koos Jansen, der schon seit längerem argumentiert und begründet, dass China etwa 1800-2000 Tonnen Gold p.a. nachfragt, wurde nun (zumindest mal für 2013) von berufener Stelle BESTÄTIGT. Und damit wurden zugleich die offiziellen aber seit Jahren manipulativ dubios niedrigen WGC-Zahlen (gut „1000 Tonnen“ für 2013) quasi offiziell „dementiert“. Der berufene Mund war Xu Luode, Chairman der Shanghai Gold Exchange (SGE). In einer Rede schon im Juni 2014 – aber von Koos jetzt verbreitet. Siehe unten Link. Wohlgemerkt: Das ist nur CHINAs Nachfrage. Der Rest der Welt inklusive Indien (geschätzte fast 1000 Tonnen Nachfrage p.a.) kann sich somit um –je nach Annahmen zum Minenoutput und Recycling– weitere 1000-2000 Tonnen Goldangebot p.a. kloppen. Ganz „logisch“, dass bei dieser physischen Marktlage der Goldpreis 2013 stark abfiel, nicht…"


Quote:

SGE Chairman: 2013 Chinese Gold Demand Was 2000t
Published: 10-10-2014 18:23
SGE Chairman: 2013 Chinese Gold Demand Was 2000t
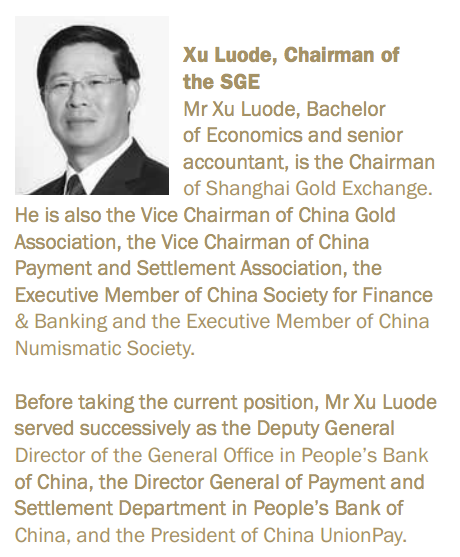
This is the final blow for the ones who still can't comprehend, after all evidence presented, the amount of Chinese non-government gold demand in 2013. At the LBMA forum in Singapore June 25, 2014, one of the keynote speakers was chairman of the Shanghai Gold Exchange (SGE) Xu Luode. In his speech he made a few very candid statements about Chinese consumer gold demandthat according to Xu reached 2,000 tonnes in 2013In contrast to the Word Gold Council (WGC) that states Chinese gold demand was 1,066 tonnes in 2013. Xu's speech has now finally been translated and published, in the LBMA magazine The Alchemist #75. 
Xu's statements once again confirm what I have been writing for months. SGE withdrawals equal Chinese wholesale demand:
import + mine + scrap = total supply = SGE withdrawals = wholesale demand
Let's go through a couple of quotes from Xu:  
Data on China’s gold imports has not previously been made available to the public. However, gold has historically been imported through Hong Kong, and Hong Kong is highly transparent, disclosing details such as the number of tonnes of gold imported on a monthly basis. Last year, China imported 1,540 tonnes of gold. Such imports, together with the 430 tonnes of gold we produced ourselves, means that we have, in effect, supplied approximately 2,000 tonnes of gold last year. 
The 2,000 tonnes of gold were consumed by consumers in China. Of course, we all know that the Chinese ‘dama’ [middle-aged women] accounts for a significant proportion in purchasing gold. So last year, our gold exchange’s inventory reduced by nearly 2,200 tonnes, of which 200 tonnes was recycled gold. 
Again, we can read the simplified equation (for 2013):
import (1540t) + mine (428t) + scrap (229t) = SGE withdrawals (2197t) 
Additionally, it's very clear what kind of metric the SGE uses. Xu subtracts recycled gold from SGE withdrawals to measure consumer demand, which equals newly added gold (import + mine = 1968t) to the private gold holdings of Chinese citizens. Confirming the Chinese gold market with the SGE at its core, is designed by the PBOC to track the quality and quantity of gold held in non-government reserves.  
By flipping the variables in the formula I was able to estimate Chinese import in 2013 (SGE withdrawals - mine - scrap = import) by an error margin of only 2.6 %. Year to date SGE withdrawals account for 1425 tonnes, of which I estimate 855 tonnes was imported. Western media are still focusing on the amount of gold Hong Kong net exports to China, which is dropping like a brick, as a proxy for Chinese imports. However, this data has dramatically lost its significance as China has openly announced it imports more gold directly into cities like Shanghai and Beijing. This was clearly communicated, see the next video from 1:14.
The Shanghai Customs department published a press release September 19 on their website saying they imported 48 batches of gold in the first eight months of this year worth $15 billion dollars, which roughly translates to 380 tonnes. Unfortunately the article does not say where this gold came from, but it very well supports the fact China continues to import large amounts of bullion, which can be seen by strong SGE withdrawal data. in September import has increased 30 % m/m. 
  
The strange thing is, there were many industry professionals and journalists in the room when Xu spoke at the LBMA forum (click for the delegate list), but only one of them rushed to his laptop during the break to share the content of Xu's speech, paramount information. He sent me an email that I immediately published for the whole world to read. This person was my friend and CEO of BullionStar, Torgny Persson.
However, there still hasn't been a single mainstream news outlet that has covered the immense discrepancy between the Chinese demand numbers from the WGC and the SGE. I would like to express my deepest concern about how the mainstream media is covering the (Chinese) gold market. Xu stated, at the most prominent precious metals forum in the world, Chinese gold demand reached 2,000 tonnes. By the way, later on in his speech he repeated it twice! 
Earlier, I have reported on the data that physical gold consumption in China’s gold market has, in effect, reached more than 2,000 tonnes last year.  All of you here are experts in this industry and are very clear about the percentage accounted for by these 2,000 tonnes of physical gold in the global market.
How could the press have missed this? A difference of 1,000 tonnes in Chinese non-government gold demand.
The first publication I posted about what Torgny emailed me from the LBMA forum can be found here. In the comment section underneath there is a conversation with Bron Suchecki who also listened to Xu's speech, however, he (and one other journalist) couldn't recall Xu saying Chinese demand hit 2,000 tonnes. Fortunately we know have it in black and white; Xu said it three times and other SGE officials have made the same statements.
I would recommend everyone to read the entire speech from Xu (here). 
Koos Jansen
Copyright information: BullionStar permits you to copy and publicize blog posts or quotes and charts from blog posts provided that a link to the blog post's URL or to https://www.bullionstar.com is included in your introduction of the blog post together with the name BullionStar. The link must be taret="_blank" without rel="nofollow". All other rights are reserved. BullionStar reserves the right to withdraw the permission to copy content for any or all websites at any time.

Donnerstag, 4. September 2014

Rohstoff- und Investoren-Legende Soros erhöht seine Wette auf einen Aktiencrash

Netter Bet vom legendären Haudegen George Soros:
"..Soros has once again increased his total SPY Put to a new record high of $2.2 billion, or nearly double the previous all time high, and a whopping 17% of his total AUM..."

Quelle: zerohedge.com, JPM


Quote:

Icahn, Soros, Druckenmiller, And Now Zell: The Billionaires Are All Quietly Preparing For The Plunge

Tyler Durden's picture


"The stock market is at an all-time, but economic activity is not at an all-time," explains billionaire investor Sam Zell to CNBC this morning, adding that, "every company that's missed has missed on the revenue side, which is a reflection that there's a demand issue; and when you got a demand issue it's hard to imagine the stock market at an all-time high." Zell said he is being very cautious adding to stocks and cutting some positions because "I don't remember any time in my career where there have been as many wildcards floating out there that have the potential to be very significant and alter people's thinking." Zell also discussed his view on Obama's Fed encouraging disparity and on tax inversions, but concludes, rather ominously, "this is the first time I ever remember where having cash isn't such a terrible thing." Zell's calls should not be shocking following George Soros. Stan Druckenmiller, and Carl Icahn's warnings that there is trouble ahead..

Sonntag, 29. Juni 2014

Wall-Street-Legende Victor Sperandeo und Edwin Vieira im Interview: "Fed ist verfassungswidrig und potenziell extrem korrupt"

Lesenswerte Bericht von ET:


"Machtgelüste an der Spitze sind gefährlich"


Wall-Street-Legende Victor Sperandeo und Edwin Vieira im Interview: "Fed ist verfassungswidrig und potenziell extrem korrupt"

von Valentin SchmidSonntag, 29. Juni 2014 06:55
Der Anwalt für amerikanisches Verfassungsrecht, Edwin Vieira Jr., erklärt die Geschichte und die rechtliche Struktur des Federal Reserve Systems (Fed). Einleitendes Statement von der Wall-Street-Legende Victor Sperandeo..

Dienstag, 10. Juni 2014

Rigged US-Leitindizes: Ein Markt, der nicht mehr korrigiert, geschweige denn fällt

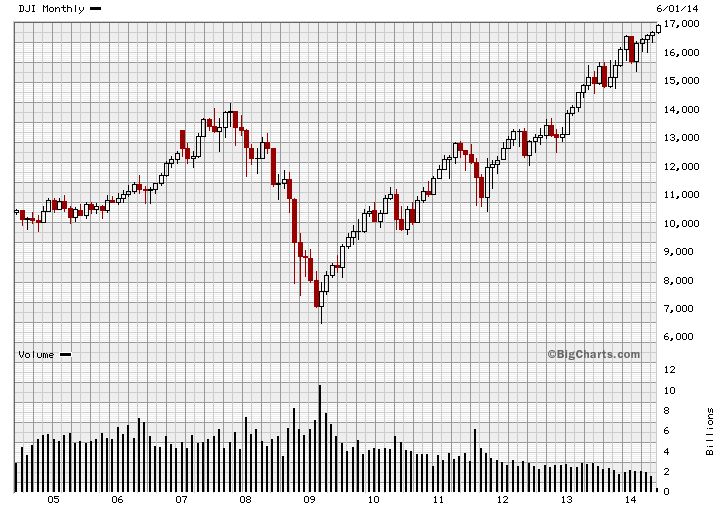
Der amerikanische Leitindex Dow Jones (DJI) verzeichnet nun bereits 32 Monate in Folge ohne eine gesunde 10%-Korrektur-Phase. Parallel fallen das relative Volumen und die Handels-Volatilität in sämtlichen Anlage-Klassen auf historische Tiefstände, und die Blasenbildung läuft mit Volldampf weiter.

Rigged Markets, created by the FED = From Central Bank to Central Planner. Die Märkte sind dermaßen von den Zentralbank-Aktionen abhängig und kontrolliert, dass selbst die großen Banken - welche eine der größten Profiteure von der historischen Geldflut sind - die irrwitzige Abhängigkeit und die krassen Markt-Verzerrungen zunehmend ankreiden

Kein Wunder, denn die Finanzbranche verdient vor allem Geld, wenn es 'Auf und ab' geht und demnach eine reale Handels-Volatilität da ist. Diese wird gerade komplett eingeäschert (siehe 'Vol dead' unten). Extrem brisant erneut anzusehen, wie "Freie Märkte" selbst in einem System voller Turbo-Kapitalismus (es profitieren eben nur die Top 1%) wahrhaftig sterben. Wie lange kann das noch so gehen? Die Ruhe vor dem Sturm oder "The Normal"..?

Sicher bin ich mir jedoch weiter; auch wenn oder genau weil die Leit-Märkte weiter völlig unbeeindruckt von ATH zu ATH laufen, dass die Finanz- und Systemkrise 2.0 die Lehman-Pleite wohl bei Weitem in den Schatten stellen kann. Es fühlt sich jetzt nach dem ultimativen Start der "Mania Phase" an..


Quelle: bigcharts.com


Quelle: bigcharts.com


Quelle: zerohedge.com

Montag, 9. Juni 2014

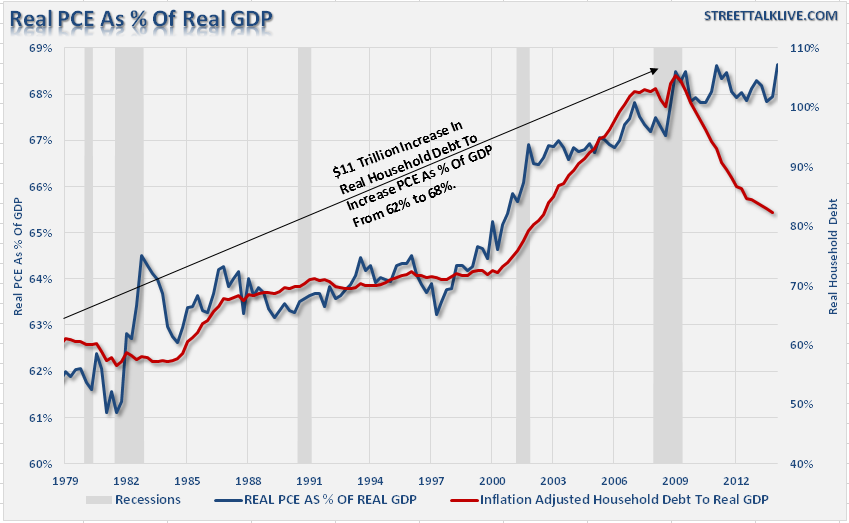
Big Picture, USA: Totale Verschuldung vs. GDP-Wachstum

"The Limits to Growth" lassen grüßen..


Quelle: zerohedge.com, streettalklive.com


Quelle: zerohedge.com, streettalklive.com


Quelle: zerohedge.com, streettalklive.com


Quelle: zerohedge.com, streettalklive.com

Freitag, 10. Januar 2014

US ADP-Arbeitsmarktbericht: Immer mehr Arbeitslose fliegen aus den beschönigten Statistiken

Der wichtigste Fakt vom heutigen US ADP-Report auf der "dunklen Seite" der Medaille - abseits der medialen Manipulationen, Statistik-Fälschungen und der amüsanten Mainstream-Verzerrungen:

"..People Not In Labor Force Soar To Record 91.8 Million.."

Quelle: http://www.zerohedge.com/news/2014-01-10/people-not-labor-force-soar-record-918-million-participation-rate-plunges-1978-level


Quelle: zerohedge.com


Quelle: zerohedge.com