Posts mit dem Label Manipulation werden angezeigt. Alle Posts anzeigen

Donnerstag, 8. September 2016

Big Picture: Bilanzsummen der wichtigsten Notenbanken steigen auf neues Rekordhoch

Die gigantische Aufblähung der Bilanzsummen der Notenbanken geht in die nächste Runde. Die aggregierte Summe der Bilanzen nähert sich bereits der Marke von unfassbaren 20 Billionen US-Dollar bzw. 40% des GDPs der involvierten Nationen..

Quelle: Citi Research, Haver

Montag, 18. April 2016

Gold- und Silberpreis: Manipulationen der Deutschen Bank nur die Spitze des Eisbergs?

Hierzu ein aktueller Bericht von Zerohedge:

Is Deutsche Bank’s Gold Manipulation The Main Scam Or Just A Side-Show?

Tyler Durden's picture


For years now, the easiest way to finesse a debate over whether precious metals markets are manipulated has been to say, “well, if they’re not manipulated they’re the only market that isn’t.”
That was unsatisfying, though, because as the big banks got caught scamming their customers on interest rates, mortgage bonds, forex and commodities trades, those markets (presumably) began to operate more-or-less honestly. Gold and silver, meanwhile, kept right on acting strangely, for instance plunging in the middle of the night on no news but massive futures volume, to the detriment of honest investors and traders who naively bet their capital on fundamentals. The (already huge) amount of money thus stolen from gold bugs kept rising.
So it is with relief that fans of honest markets have greeted the news that at least one kind of precious metals manipulation has been exposed..

Quelle: stockcharts.com

Mittwoch, 10. Februar 2016

London Metal Exchange (LME): 10% der Mitglieder verlassen die traditionsreiche Metallbörse

Äußerst brisante News!

"Stunning!" Ten Percent of London Metals Exchange (LME) Members QUIT!

Six of the world’s largest mining companies – including the world’s second largest miner, Rio Tinto – abruptly resigned their membership on the London Metal Exchange. No reason was given for why 10% of the Exchange’s “Category 5” members resigned, but many are speculating that it has something to do with ongoing criminality in the fraudulent paper markets..

Linkhttps://www.superstation95.com/index.php/world/875

Freitag, 27. November 2015

Ausverkauf an Thanksgiving: Gold bricht durch massive Future-Verkäufe auf neues 6-Jahrestief ein

Das passt heute beim Goldpreis mal wieder bestens zusammen. Wasser auf den Mühlen der Systemkritiker, denn offensichtlicher kann eine Manipulation erneut nicht mehr ausfallen.

Man achte auf die Kontraktgröße und das das Timing des Mega-Verkaufs am Future-Markt.

Wie erwartet will man den (Papier-)Goldpreis noch tiefer sehen. Time will tell..

Gold Plunges Below "Crucial Level", Lowest Since Oct 2009 On $2 Billion Notional Flush

Tyler Durden's picture


With the world closest to World War 3 since the cold war era and Russia about to unleash escalating sanctions of Turkey, it makes perfect sense that 'investors' would want to purge themselves of precious metals. "Someone" decided that Friday after Thanksgiving would be the perfect time to dump over 18,000 contracts (around $1.9 billion notional) sending the price of gold futures to their lowest since Oct 2009, below what Goldman called a "crucial level."
Over 18000 contracts dumped...

Sending gold futures prices to Oct 2009 lows...

As Goldman notes, in Gold, the critical level is 1,068-1,066. In Silver, support spans 13.98-13.83.

Gold Daily/Weekly – The level to watch in Gold is 1,068-1,066. This includes an ABC equality target off the January high and the trend across the lows since Dec. ’13.
The fact that oscillators are diverging positively suggests that price may be attempting to stabilize. Failure to break this support area confirms that the setup is still corrective; that a 5-wave sequence from ’11 highs ended in July. Alternatively, a break lower would warn that the market hasn’t yet completed its impulsive decline.
This would open potential to extend towards 966 (a 1.618 extension target from the January high).

Silver Daily/Monthly – The level to watch here is 13.98-13.83. This includes the previous low from Aug. 26th and the trend across the lows since Jun. ’03.
Although the wave count on Silver is a lot less evident than the one for Gold, it is apparent that rallies have all met ABC targets insinuating that rallies lack impulse. On a more positive note, daily oscillators are crossing higher from the bottom of its range.
Put another way, the balance of signals seems mixed; 13.98-13.83 does however look significant..

Mittwoch, 29. Juli 2015

Gold, Silber: Angebot und Nachfrage am Termin-Markt

MUST READ - credit to Zerohedge:

Supply And Demand In The Gold And Silver Futures Markets

Tyler Durden's picture


This article establishes that the price of gold and silver in the futures markets in which cash is the predominant means of settlement is inconsistent with the conditions of supply and demand in the actual physical or current market where physical bullion is bought and sold as opposed to transactions in uncovered paper claims to bullion in the futures markets. The supply of bullion in the futures markets is increased by printing uncovered contracts representing claims to gold. This artificial, indeed fraudulent, increase in the supply of paper bullion contracts drives down the price in the futures market despite high demand for bullion in the physical market and constrained supplyWe will demonstrate with economic analysis and empirical evidence that the bear market in bullion is an artificial creation.
The law of supply and demand is the basis of economics. Yet the price of gold and silver in the Comex futures market, where paper contracts representing 100 troy ounces of gold or 5,000 ounces of silver are traded, is inconsistent with the actual supply and demand conditions in the physical market for bullion. For four years the price of bullion has been falling in the futures market despite rising demand for possession of the physical metal and supply constraints.
We begin with a review of basics. The vertical axis measures price. The horizontal axis measures quantity. Demand curves slope down to the right, the quantity demanded increasing as price falls. Supply curves slope upward to the right, the quantity supplied rising with price. The intersection of supply with demand determines price. (Graph 1)
Supply and Demand Graph 1
A change in quantity demanded or in the quantity supplied refers to a movement along a given curve. A change in demand or a change in supply refers to a shift in the curves. For example, an increase in demand (a shift to the right of the demand curve) causes a movement along the supply curve (an increase in the quantity supplied).
Changes in income and changes in tastes or preferences toward an item can cause the demand curve to shift. For example, if people expect that their fiat currency is going to lose value, the demand for gold and silver would increase (a shift to the right).
Changes in technology and resources can cause the supply curve to shift. New gold discoveries and improvements in gold mining technology would cause the supply curve to shift to the right. Exhaustion of existing mines would cause a reduction in supply (a shift to the left).
What can cause the price of gold to fall? Two things: The demand for gold can fall, that is, the demand curve could shift to the left, intersecting the supply curve at a lower price. The fall in demand results in a reduction in the quantity supplied. A fall in demand means that people want less gold at every price. (Graph 2)
Supply and Demand Graph 2
Alternatively, supply could increase, that is, the supply curve could shift to the right, intersecting the demand curve at a lower price. The increase in supply results in an increase in the quantity demanded. An increase in supply means that more gold is available at every price. (Graph 3)
Supply and Demand Graph 3
To summarize: a decline in the price of gold can be caused by a decline in the demand for gold or by an increase in the supply of gold.
A decline in demand or an increase in supply is not what we are observing in the gold and silver physical markets. The price of bullion in the futures market has been falling as demand for physical bullion increases and supply experiences constraints. What we are seeing in the physical market indicates a rising price. Yet in the futures market in which almost all contracts are settled in cash and not with bullion deliveries, the price is falling..

Montag, 27. Juli 2015

Gold: Abkopplung des physischen Markts vom Terminmarkt hält an

Hierzu ein Beitrag von Zerohedge, der auf die jüngsten Daten zu den Unzenverkäufen in den USA eingeht:

US Mint Sells Most Physical Gold In Two Years On Same Day Gold Price Hits Five Year Low

Tyler Durden's picture


Three weeks ago, we reported that the US Mint had run out of physical silver on the same day silver plunged to its lowest price in 2015. This happened just days after the UK Royal mint announced that "during June, we experienced twice the expected demand for Sovereign bullion coins from our customers based in Greece."
While the surge in physical demand clearly did not explain the liquidation in the price of "paper" silver, we are still hoping that the OCC writes us back with an explanation why this happened, and maybe it can clarify also just how much more silver the mint will sell before it runs out of silver in inventory again as it did 20 days ago.
We bring all of this up because just like 20 days ago when unstoppable demand for physical silver met an immovable paper silver selling object (with the "object" for now winning), so earlier today the price of gold tumbled to the lowest level in 5 years, some $1,072 per ounce, before it staged a dramatic comeback closing just under $1,100...

... thanks in no small part to the illegal spoofing we noted earlier.

And lo and behold, just like in the case of silver three weeks ago, today's gold liquidation was not due to selling of physical metal. In fact, quite the contrary: according to the US mint, so far in July the mint has sold a whopping 143,000 ounces of physical gold - the most in over two years, or since April of 2013 - even as the price of gold briefly slid to the lowest level in 5 years.
In other words, retail investors, who have bought over 7 million ounces of gold since January 2008 or the one third the total "held" currently by the GLD ETF, were eagerly buying up all the physical they could get their hands on, or said otherwise, "taking delivery" at the prevailing price, a process which practically assures that the US Mint will be out of gold in the next few days.
We wonder when some central banks, the bulk of whose gold remains in "deliverable" format, decide to do the same? A few more down days in the stock market, coupled with a record high hedge fund short interest, and we just may get our answer..

Sonntag, 26. Juli 2015

Goldseiten: "Minen so günstig wie nie zuvor"

Recommendation. Sehr guter und lesenswerter Beitrag von Analyst Markus Blaschzok auf Goldseiten:

Edelmetalle und Minen günstig wie nie

25.07.2015  |  Markus Blaschzok
Am noch sehr frühen Montagmorgen um 3:29 Uhr brach der Goldpreis im dünnen Nachthandel in einem Flash Crash von nur einer Minute um fast 60 US-Dollar ein. Der Verkaufsdruck war so stark, dass binnen dieser einen Minute der Handel sogar zweimal um jeweils 20 Sekunden unterbrochen wurde.

Der Abverkauf startete mit dem Unterschreiten des Tiefs vom letzten November bei 1.130 US-Dollar. An und unter dieser charttechnischen Unterstützungsmarke lagen viele automatische Stop-Loss Verkauforders, die in einer Kettenreaktion den Abverkauf noch verstärkten. Es gibt einige Indizien dafür, dass es sich bei diesem Abverkauf nicht um ein natürliches Marktphänomen handelte, bei dem eine wichtige Unterstützung einfach zu einer Handelszeit mit sehr dünnen Umsätzen gebrochen wurde.

Erst am Wochenende hatte ich in einem Artikel und in einem Interview auf der Metallwoche darauf hingewiesen, dass die US-Terminmarktdaten bereits in allen vier Edelmetallen gut seien, man aber im Gold und insbesondere im Silber immer noch eine hohe Manipulation erkennen konnte. Daher war meine Vermutung, dass die Unterstützung bei 1.130 US-Dollar brechen sollte, um einerseits den Goldpreis drücken zu können und andererseits JP Morgan die Chance zu geben, die immer noch sehr hohe Netto-Shortposition von 60 Tagen der Weltproduktion im Silber zumindest teilweise schließen zu können. 

Eine Bestätigung für diese Theorie ist im Silber zu finden, das fast überhaupt nicht auf den Preiseinbruch von Gold reagierte und am Ende des Crashtages sogar auf dem gleichen Niveau wie zum Vorwochenschluss aus dem Handel ging. Die neuesten Terminmarktdaten bestätigen bereits, dass sich JP Morgan während des Goldcrashs im Silber eingedeckt und den Preis gestützt hat. Ohne diese Käufe wäre auch der Preis von Silber durch automatische Handelssysteme und StopLoss Orders in den Keller gedrückt worden.

Ein weiterer Hinweis auf eine Manipulation ist der Startzeitpunkt des Abverkaufs an der COMEX exakt eine Minute vor dem Handelsbeginn an der Shanghai Gold Exchange und der in Asien sofort begonnene Verkauf von physischem Gold im Volumen von 5 Tonnen binnen einer halben Stunde. Dieses Vorgehen ist nötig, um den Preis auf dem niedrigeren Niveau halten und verräterische Terminmarktpositionen aus dem Flash Crash wieder reduzieren zu können. Ich vermute also, dass der eigentliche Hintergrund des Flash Crashs weniger im Gold- als vielmehr im Silbermarkt zu finden ist. 

Wir konnten unsere Abonnenten auf die beobachtete Manipulation der Vorwochen hinweisen und empfahlen wegen der Manipulation weiter abzuwarten.

Minen zurück auf den Niveaus der Jahrtausendwende

Während Silber in US-Dollar auf dem niedrigsten Stand seit fast sechs Jahren und Gold seit fünf Jahren notiert, sind die Gold- und Silberminen überproportional stärker gefallen seit den Hochs des Jahres 2011. Der NYSE Arca Gold Bugs Index notiert mit 110 Punkten auf dem gleichen Niveau wie im Jahr 2002 als die Feinunze Gold noch für 310 US-Dollar zu haben war.

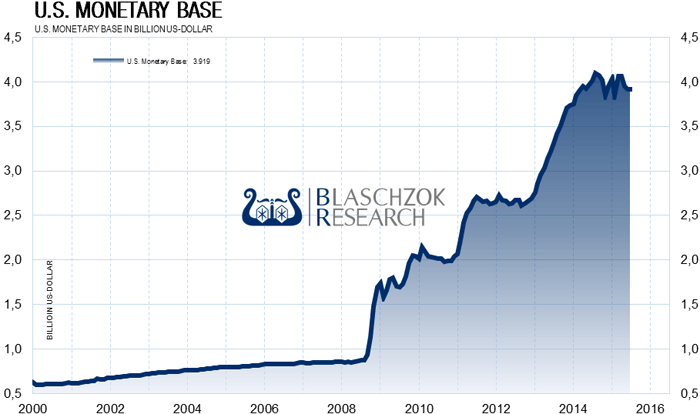
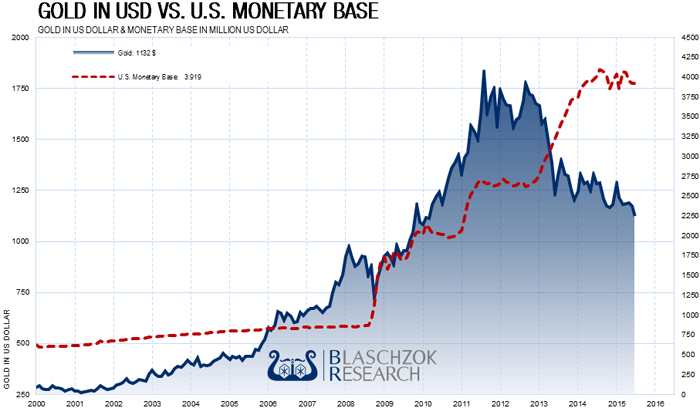
Berücksichtigt man, dass die Geldbasis in den USA durch die drei QE-Programme seit Anfang 2008 um 380% ausgeweitet und der US-Dollar somit abgewertet wurde, sind die Minen im Vergleich zu der Geldbasis sowie im Vergleich zu Gold historisch einmalig unterbewertet. Für strategisch agierende Investoren, die auf mehrere Jahre bis zu einem Jahrzehnt hin denken und investieren, sind die Minen daher jetzt sehr interessant und das Smart Money dürfte jetzt mit der langfristigen Akkumulation beginnen. 

Open in new window
Die US-Basisgeldmenge stieg seit Anfang 2008 um über 380% an. In ihr liegt der Grund für die Abwertung des US-Dollars und dem Anstieg der Edelmetallpreise. Wir erwarten in 2016 ein viertes QE-Programm in den USA, das für einen weiteren Anstieg der Geldmenge sorgen wird.


Die Geldmengenausweitung ist, wie an dieser Grafik sichtbar, der primäre Grund für den Anstieg der Edelmetallpreise. Auch Gold und Silber notieren im Vergleich zu der Ausweitung der Geldmenge in den USA aktuell auf einem niedrigeren Niveaus als im Jahr 2000, als Gold noch bei 250 US-Dollar je Feinunze notierte.

Open in new window
Die US-Basisgeldmenge stieg seit Anfang 2008 um über 380% an und ist der primäre Faktor, warum die Edelmetallpreise steigen.


Berücksichtigt man die Ausweitung der Geldbasis und somit die Abwertung des US-Dollars, entspräche der heutige Indexstand des HUI Gold-Bugs Index bei 115 Punkten, einem Stand von 18 Punkten im Jahr 2000. Da auch der Goldpreis 300% höher steht als zur Jahrtausendwende, ist die reale Unterbewertung im Vergleich zum Goldpreis ebenso historisch einmal..


Donnerstag, 23. Juli 2015

Der große Bär geht um: Goldman Sachs verbreitet weitere Schock-Meldungen zum Goldpreis

Perfect timing ;-)

Dropping Below $1,000 on Dollar

by Debarati Roy July 22, 2015 — 12:05 AM CESTUpdated on July 22, 2015 — 1:00 PM CEST

Goldman Sachs Group Inc.’s Jeffrey Currie says the worst is yet to come for gold and that prices could fall below $1,000 an ounce for the first time since 2009.

“With the more positive outlook on the dollar, and with debasement risk starting to fade, the demand to use gold as a diversifying asset against the U.S. dollar becomes less and less important,” said Currie, who told investors to sell in 2013 before the metal’s biggest collapse in three decades.

Prices this week slumped to the lowest since 2010. The rout is deepening amid mounting speculation that U.S. interest rates will climb this year, curbing the appeal of bullion because it doesn’t pay interest like competing assets. At the same time, China bought less of the metal than analysts were expecting, and the dollar keeps getting stronger..

Linkhttp://www.bloomberg.com/news/articles/2015-07-21/goldman-s-currie-sees-gold-dropping-below-1-000-as-rout-deepens


Montag, 20. Juli 2015

Gold: Gewaltiger Flash-Crash führte heute Nacht zu gleich zwei Handelsunterbrechungen im Asien-Handel

Beeindruckender Chart von Nanex zum Desaster im Goldpreis heute Nacht:

Quelle: Nanex, Zerohedge.com


Quelle: stockcharts.com


Quote:

Last Night's Gold Slam So Furious It Halted The Market Not Once But Twice, And The Funniest "Explanation" Yet

Submitted by Tyler Durden on 07/20/2015 12:35 -0400


Yesterday, just before the Chinese market opened, precious metals but mostly gold, flash crashed in milliseconds with a violent urgency never before seen. We documented the unprecedented event last night, but for those who missed it, the following chart from Nanex clearly lays out just how sudden the "out of nowhere" selling was, which led to not one but two 20-second halts in the gold futures market spaced out precisely 30 seconds apart as a result of a Velocity Logic (or lack thereof) event..

Gold, Silber, Platin: Nächster initiierter Flash-Crash bei den Edelmetallen im frühen Asien-Handel heute Nacht

Credit to Zerohedge:

Gold, Precious Metals Flash Crash Following $2.7 Billion Notional Dump

Tyler Durden's picture


The last time gold plummeted by just over $30 per ounce (dragging down silver and bitcoin with it) and resulted in a crash so furious it led to a "Velocity Logic" market halt for 10 seconds, was on January 6, 2014. Many said this was just perfectly normal selling, although we explicitly said (and showed) that it was a clear case of an HFT algo gone wild (following an order to do just that and slam all sell stops) when someone manipulated the market and repriced gold substantially lower.

Precisely one month ago, some 18 months after the incident, the Comex admitted as much, when it blamed the collapse on "unusually large and atypical trading activity by several of the Firm’s customers and caused the mass entry of order messages by Zenfire, which resulted in a disruptive and rapid price movement in the February 2014 Gold Futures market and prompted a Velocity Logic event." Curiously despite the "errant" order, gold did not rebound because the entire purpose of the selling slam was to reset the prevailing price far lower. This is what the Comex said in Disciplinary action 14-9807-BC:
Pursuant to an offer of settlement Mirus Futures LLC (“Mirus” or the “Firm”) presented at a hearing on June 16, 2015, in which Mirus neither admitted nor denied the rule violations upon which the penalty is based, a Panel of the COMEX Business Conduct Committee (“BCC”) found that it had jurisdiction over Mirus pursuant to Exchange Rule 418 and that on January 6, 2014, Mirus failed to adequately monitor the operation of its trading platform (Zenfire), and connectivity of its trading system (Zenfire) with Globex. This failure resulted in unusually large and atypical trading activity by several of the Firm’s customers and caused the mass entry of order messages by Zenfire, which resulted in a disruptive and rapid price movement in the February 2014 Gold Futures market and prompted a Velocity Logic event.

The Panel found that as a result, Mirus violated Rules 432.Q. (Conduct Detrimental to the Exchange) and 432.W.
We bring this up because moments ago, just before 9:30pm Eastern time or right as China opened for trading, gold (as well as platinum, silver, and virtually all precious metals) flashed crashed when "someone" sold $2.7 billion notional in gold, resulting in a 4.2% or about $50 to just over $1,086/oz, the lowest level since March 2010.
Gold:

Silver:

Platinum:

Once again, as in February 2014 and on various prior cases, the fact that someone meant to take out the entire bid stack reveals that this was not a normal order and price discovery was the last thing on the seller's mind, but an intentional HFT-induced slam with one purpose: force the sell stops.
So what caused it?
The answer is probably irrelevant: it could be another HFT-orchestrated smash a la February 2014, or it could be the BIS' gold and FX trading desk under Benoit Gilson, or it could be just a massive Chinese commodity financing deal unwind as we schematically showed last March...
... or it could be simply Citigroup, which as we showed earlier this month has now captured the precious metals market via derivatives.

Whatever the reason, gold just had its biggest flash crash in nearly two years, as a targeted stop hunt launched by the dumping of $2.7 billion notional in product, accelerates the capitulation of the momentum buyers (and in this case sellers) pushing gold to a level not seen almost since 2009.
The price appears to have rebounded after the initial shock, up about $20 from the intraday low of $1,086 but we expect that to be retested shortly, and for gold to plunge further into triple digits, at which point gold miners will simply cease to produce the metal whose all-in production cost is in the $1100 and higher range, when it will also become clear that only derivatives and "paper" are the marginal "price" setters..

Donnerstag, 9. Juli 2015

Silber: JP Morgan's physischer Kaufrausch reißt nicht ab

Während der Papier-Silberpreis (SLV) diese Woche schon fast dabei war auf neue Mehrjahres-Tiefstände einzubrechen, steigert der einflussreichste Spieler im Edelmetall-Derivatemarkt seine Long-Positionen auf Silber weiter.

JP Morgan's (NYE:JPM) physische Silber-Bestände überschreiten Anfang Juli die Marke von signifikanten 60 Millionen Silber-Unzen. Der folgende Chart spricht wahrlich Bände..

Quelle: goldchartsrus.com

Sonntag, 5. Juli 2015

Wie JPMorgan im Rohstoffmarkt: Citigroup cornered Edelmetall-Derivatemarkt

Die einflussreichen Big Player der amerikanischen Finanzindustrie lassen mal wieder die Muskeln spielen.

JPMorgan übernimmt quasi im Alleingang das Ruder im riesigen Rohstoff-Derivatemarkt, während Citi nun den Edelmetall-Derivatemarkt kräftig aufwirbelt..

Citigroup Just Cornered The "Precious Metals" Derivatives Market

Tyler Durden's picture


One week ago, when we scoured through the latest OCC quarterly derivative report (in which we find that the top FDIC insured 4 US banks continue to account for over 90%, or $185.5 trillion of all outstanding derivatives which as of March 31 amounted to $203 trillion; nothing new here), we found something fascinating: based on the OCC's derivative update, JPM had literally cornered the commodity derivatives complex, when from "just" $226 billion in total Commodity exposure, JPM's notional soared by 1,690% in one quarter to $4 trillion, or about 96% of total..
..
However, another big question remains: just what is Citigroup - not, not JPMorgan - with the Precious Metals category.
Here is the chart showing Citigroup's Precious Metals (mostly silver now that gold is lumped in with FX), exposure over the past 4 years. Of note: the 1260% increase in Precious Metals derivative holdings in the past quarter, from just $3.9 billion to $53 billion!

Quelle: zerohedge.com


Quelle: zerohedge.com

Dienstag, 30. Juni 2015

JPMorgan manipuliert erneut im großen Stil den Rohstoff-Derivate-Markt

Aktuelles Update von Zerohedge mit großartigen Charts und Einblicken:

JPMorgan Just Cornered The Commodity Derivative Market, And This Time There Is Proof

Tyler Durden's picture


For years there had been speculation, rumor and hearsay that JPM had cornered the US commodities market. Now, finally, we have documented proof.
* * *
Traditionally, we look at the OCC's Quarterly Bank Report on derivatives activities to see which was the largest bank in the US in terms of total notional derivative holdings. The reason being that like on frequent occasions in the past, we find some stunning  results, such asmost recently in January when we wrote that, for the first time, Citigroup had eclipsed JPM as the largest US bank in total derivatives, with just over $70 trillion compared to perennial megabank JPM's $65.3 trillion as of the third quarter of 2014, explaining also why Citigroup had drafted the Swaps push out language in the Omnibus Bill..


Montag, 29. Juni 2015

Bank Run, Eskalation im Finanzsektor, steigende Renditen, Verschärfung der Krise, Physischer Goldrausch etc. und was macht der Goldpreis?

Er hält sich mühsam im Plus. Welcome to "free markets" in 2015 - special thanks to PPT, COMEX, LBMA, BIS & Co. (;

Quelle: goldprice.org


Quote:

Gold Tumbles Despite UK Mint Seeing Europeans Rush To Buy Bullion

Tyler Durden's picture


European investors are increasing purchases of gold as Bloomberg reports, Greece’s turmoil boosts the appeal for an alternative to the euro. Demand from Greek customers for Sovereign gold coins was double the five-month average in June, the U.K. Royal Mint said in an e-mailed statement.As one Frankfurt-based bullion dealer noted, "most of our common gold coins are sold out, when people learned that the Greek banks will be closed, they started to think that it may not be such a bad idea to have some money in gold."
Emailed statement from UK Mint...

Montag, 22. Juni 2015

Uranium Energy: Offizielle Firmen-Meldung zur Short-Attacke, großer Firmen-Meilenstein durch erfolgreiche Aufnahme in Russell-Indizes

Der amerikanische Uran-Konzern Uranium Energy (NYE:UEC) reagierte noch am Freitag auf die krasse Short-Attacke von TheStreetSweeper mit einer kurzen, aber prägnanten Presse-Meldung.
"..The subject press releases have absolutely no merit and are comprised of unfounded allegations made by a third party whose motives are questionable. The Company has reviewed the referenced article. The Company’s SEC disclosure is very clear and we will not comment further on the possibility of groundless, frivolous litigation. UEC is in discussions with counsel with a view to doing whatever is necessary to bring these parties’ motives to light and to seek such legal and equitable relief and any and all damages suffered by the Company and any of its shareholders as a consequence of these unfounded allegations..."

Heute gibt die Uran-Firma eine klasse News bekannt, die einen großen Firmen-Meilenstein darstellt. Uranium Energy wird in zwei renommierte Small Cap Indizes in den USA aufgenommen:
Uranium Energy Corp to be Added to Russell 3000 Index and Russell Global Index 
Corpus Christi, TX, June 22, 2015 – Uranium Energy Corp, (NYSE-MKT: UEC, “the Company”), a U.S.-based uranium mining and exploration company, is pleased to announce that the Company is to be added to the Russell 3000Ò Index and the Russell Global Index at the conclusion of the annual reconstitution of the Russell indexes on June 26, 2015, according to the latest list of additions as posted June 19, 2015 on FTSE Russell’s website at:
http://www.russell.com/indexes/americas/tools-resources/reconstitution/additions-deletions.page

Die Uranium-Aktie kann sich daraufhin kräftig erholen (siehe Chart unten). Sehr zu empfehlen sind auch die aktuellen Kommentare vom bekannten Mining-Analyst & Head of Metals & Mining Rob Chang von Cantor Fitzgerald zum jüngsten Event bei Uranium Energy:
"The power of the internet sometimes is a bit unfair. UEC is down 30% today on the back of a negative blog and subsequent legal action by two law firms with a history of filing corporate lawsuits. Sometimes it’s better to read articles from the bottom up as the disclosure of a short position at the end of the blog is perhaps the most important sentence in the entire article. Our thoughts below."

by Rob Chang


Uranium Energy Corp. | Buy | Target $3.10 | UEC-NYSE $1.68 | Market Cap US$270.7M


Negative blog and questionable legal actions irrationally drop UEC 30% 

Event: A blog with a disclosed short position on UEC issued comments that were apparently sufficient grounds for two legal firms to press release their initiation of investigations against UEC.


Bottom line: Based on our years of following the uranium space and coverage of Uranium Energy Corp, we do not share the view held by the blog or the two legal entities launching the investigation. The fact that two legal investigations were initiated solely off of an article disclosing a short position on the stock is baffling. We view any pressure on the stock based on these news items as irrational. We are maintaining our Buy Recommendation and a $3.10 per share target.
  • Previously unknown financial blog, TheStreetSweeper.org, published a negative opinion on Uranium Energy Corp on June 18, 2015.
- Among the opinions offered, the blog noted that the company had made “zero sales in the past seven quarters”.
  • We note that this is common practice in the resource industry as production is shut-in when commodity prices do not provide a reasonable return to the operator. In fact, at Cantor Fitzgerald’s Global Uranium Conference earlier this month, nearly every presenter spoke about reduced production around the world due to low uranium prices.
- However most important is the disclosure written at the bottom of the article that reads, “The owners of TheStreetSweeper hold a short position in UEC and stand to profit on any future declines in the stock price.”
  • Citing the article from the blog, two legal firms press released that they were launching investigations against UEC. No other sources were cited.
- These two firms had previously launched a lawsuit against Uranerz Energy’s merger with Energy Fuels (EFR-TSX, UUUU-Nasdaq, Under Review), which announced the closing of its transaction yesterday.
- In fact, searching the internet yields a long list of lawsuits filed by both of these firms against several companies across several industries.


Click here for our most recent update


Quelle: bigcharts.com


Quelle: bigcharts.com


Quote:

Uranium Energy: Short-Attacke von TheStreetSweeper führt zu scharfem Ausverkauf, Investigationen gestartet

Ein einflussreicher US-Spieler zerreißt die Uran-Firma und fährt auf der Short-Seite massive Gewinne ein..

Link: http://rohstoffaktien.blogspot.de/2015/06/uranium-energy-short-attacke-von.html

Freitag, 19. Juni 2015

Uranium Energy: Short-Attacke von TheStreetSweeper führt zu scharfem Ausverkauf, Investigationen gestartet

Ein einflussreicher US-Spieler zerreißt die Uran-Firma und fährt auf der Short-Seite massive Gewinne ein.
"..We expect the stock price to drop by more than a buck, down to $1.50.
* Important Disclosure: The owners of TheStreetSweeper hold a short position in UEC and stand to profit on any future declines in the stock price.."

Quelle: bigcharts.com


TheStreetSweeper.com

Uranium Energy Corporation: The Bad News Buried In The Recent Sale

by Sonya Colberg, Senior Editor - 6/18/2015 9:59:59 AM
Uranium mining company Uranium Energy Corp (UEC) is digging all the love it’s getting from the market right now. But after we mined into company documents, we couldn’t resist humming the cowboy song, “You Done Tore Out My Heart and Stomped That Sucker Flat.”
Uranium Energy looks ready to do just that to investors.
The company has not responded to TheStreetSweeper’s request for comment but investors may find other viewpoints here. Meanwhile, we’ve leaned on some ol’ country songs to help us croon out the risks.
*”If The Jukebox Took Teardrops,” Or Market’s Feeling The Pain
While UEC stock is up, the company’s peers are all down.
(Source: Yahoo Finance)
The reason the sector’s performance remains so terrible is because uranium spot prices of about $36 are at a five-year low, as shown below.
(Source: Bloomberg)
So these factors indicate that UEC’s recent price performance is unsustainable because the fundamentals of the company (more on that below) and the sector have not improved. We expect the stock will collapse as it follows the path set by peers.  
*UEC is “Busted”
UEC reports zero sales in the past seven quarters from its sole producer, the Palangana Mine.
UEC and other uranium companies were hurt after the Fukushima nuclear disaster hit in March 2011. Public pressure mounted and the negative effects have lingered and lower oil and gas prices have made the situation worse as of late for uranium companies. During its spotty history, UEC generated “no revenues from the sale of U3O8 generated during Fiscal 2014 or prior to Fiscal 2012.”
No surprise, then, that UEC shareholders have endured a long history of horrid earnings:
(Source: Bloomberg)
*”Baby, That Dog Won’t Hunt,” And UEC Won’t Produce
So the company is not even operating, as shown here.
The reason UEC was able to boost its cash recently is simply because it sold $3 million worth of uranium held in inventory. 
The company sold 80,000 pounds of finished uranium. But they blew almost the entire wad. The excerpt from SEC filings, here, shows that only 4,000 pounds remain in inventory.
“… finished goods inventory balance of 84,000 pounds of U3O8 remaining as of April 30, 2015. Subsequent to April 30, 2015, the Company sold 80,000 pounds of finished goods-uranium concentrates from inventory generating gross sales of $3,080,000.”
So, while the $3 million sale helped, the party’s over. Even if the company sold every last remaining ounce at $38 per pound (2 bucks above today’s price), it would mean only about $152,000 to UEC.
That’s nothing, especially to a company that is sitting on its last few bucks and currently has no way to generate revenue.
*”Kick The Dust Up,” And The Hype, Too!
UEC has been running up on promotions coming from Twitter, Seeking Alpha authors and reportedly hype paid by the company itself.
Here is an example of a bullish tweet:

Here is one Seeking Alpha author’s bullish headline: “Uranium Energy Corp. Will Ride The Uranium Bull.”
Though we prefer this SA article: “Uranium Energy Overvalued Even At $2 – Better Choices For Speculating On Uranium Abound.”
And here is the hotstocked.com piece, titled: “And the Pump Initiator is … ShazamStocks Powered by Uranium Energy Corp.”
Additionally, insider buying has served as a promotional tool. But investors shouldn’t be thrown off by the CEO, who earns $640,000, making a small 34,000-share stock purchase. We contend it’s window dressing …. A little more come hither.
*Conclusion: “There’s A Tear In My Beer”
With no uranium production, UEC stock has rallied due to the inventory sale, some Japanese nuclear restart news and the small insider purchase – despite the fundamental shift in the uranium industry.
UEC has always lost money, has significant negative cash flow, has yet to achieve profitability and is struggling to operate as a going concern.
It really all comes down to this: The company is poor - down to about $6 million working capital as it burns about $4 million per quarter even in its current non-productive condition.
We expect UEC would have to see if and when uranium prices reach $45 to $50 per pound before it could justify restarting operations. In that event, an analyst estimates it would take two quarters and another $10 million or so per quarter simply to prep the mine.
So, a dilutive stock offering is just about the only thing left to prop up this company  - and it’s sure to leave investors singing, “I’ve Got Tears In My Ears From Lying On My Back Cryin’ Over You.”
We expect the stock price to drop by more than a buck, down to $1.50.
* Important Disclosure: The owners of TheStreetSweeper hold a short position in UEC and stand to profit on any future declines in the stock price. 
Editor's Note: As a matter of policy, TheStreetSweeper prohibits members of its editorial team from taking financial positions in the companies that they cover. To contact Sonya Colberg, the author of this story, please send an email to editor@thestreetsweeper.org or scolberg@thestreetsweeper.org..


Quelle: bigcharts.com